PAnalytics for
Microsoft 365

Dashboards, visitor intelligence, behavior analytics, and scheduled reports — one workspace across your entire SharePoint estate. Here's exactly what you can capture and see.
Dashboards
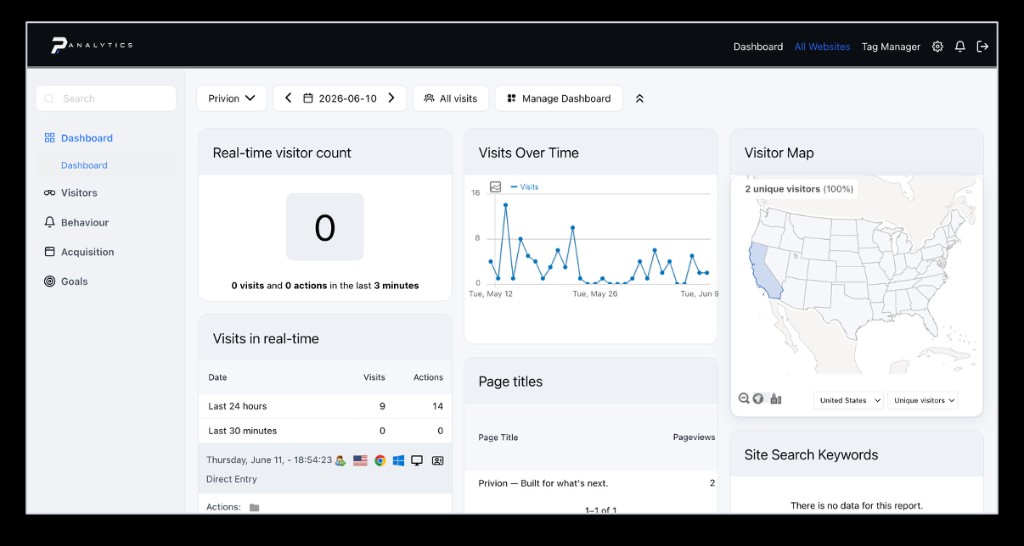
One dashboard, every metric
Your team lands on a dashboard built from widgets — one per metric. Customize it to the metrics that matter most, or spin up additional dashboards as needed. Export widget data to Excel or CSV, save any metric as an image, and annotate your timeline to mark events like an intranet launch.
Visitors
Who's using your environment, and how
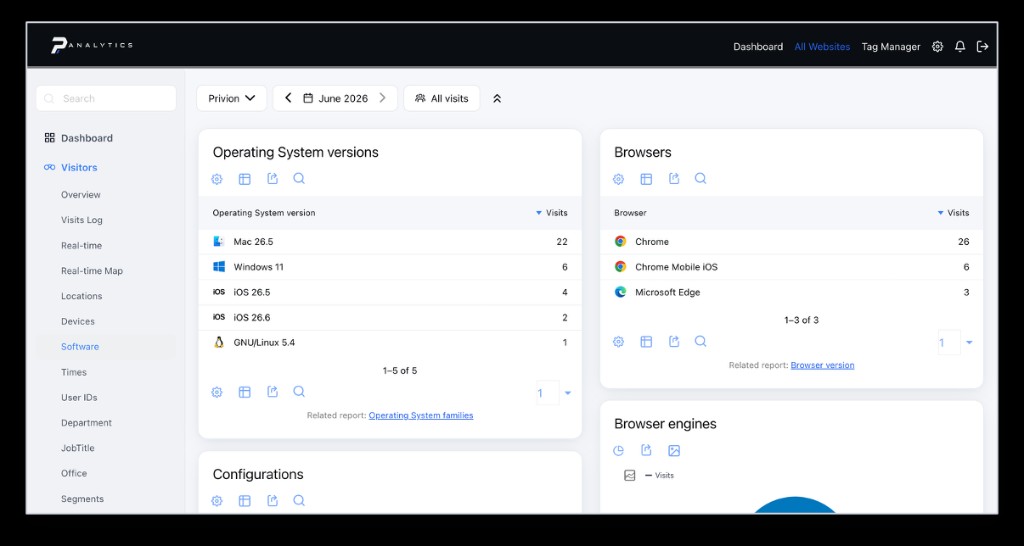
The Visitors reports show the popularity of your sites: how many visits you receive over any period, and the average engagement on key actions like searches and downloads. Adoption answered with hard data — who your visitors are, where they are, and how they engage.
Visitor Profiles
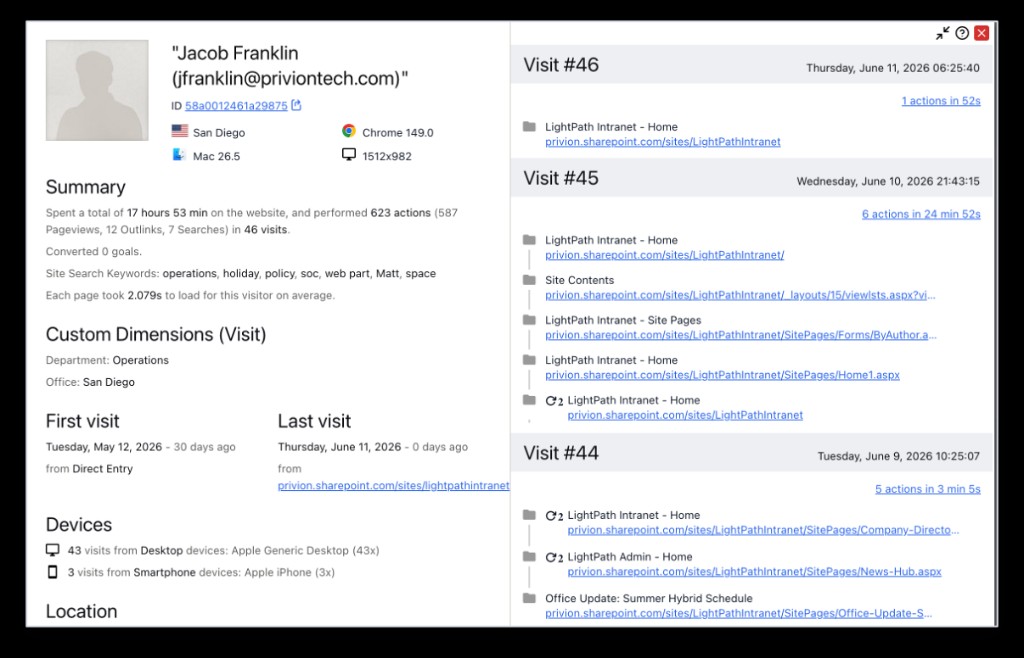
Every user, one profile
Per-user profiles are admin-controlled and aligned with your existing workplace data policies, with configurable retention. See lifetime totals, custom dimensions like department and office attached to every visit, page-by-page session detail, and device breakdowns.
And the rest
Every Visitors and Behavior report, one workspace.
Locations
Countries, regions, and cities in table and map form, plus a real-time map refreshing every five seconds.
Times
Popular local and server times — ideal for scheduling content and maintenance windows.
Devices & Software
Device types, models, operating systems, browsers, and plugins your audience actually uses.
Pages, Entry & Exit
Every visited URL as a folder hierarchy, plus the first and last pages of each session.
Downloads & Outlinks
Which files visitors download and how often, plus clicks that take them to another domain.
Site Search
Keywords visitors use, pages viewed after searching, and the searches that return no results.
Microsoft 365 & beyond
Adoption, security, and automation in one platform.
Beyond SharePoint
Seven service families — Exchange, Teams, SharePoint, OneDrive, Forms, Copilot, and M365 Apps — synced from Microsoft Graph, with per-user detail on mailbox activity, meetings, file sharing, and Copilot adoption.
Security posture, tracked daily
Your tenant's Microsoft Secure Score synced from Graph with daily history — Apps, Data, and Identity scored separately so you spot drops the moment they happen.
Automated email reports
Skip the portal: configure a report with the segment, cadence, period, recipients, display options, and exact metrics, then have it delivered on a schedule.
Operating Model
Treat workplace measurement as a governed service.
PAnalytics is hosted and operated by Privion rather than handed over as an analytics stack for the customer to maintain. Privion says the measurement engine is built on Matomo and can incorporate custom user properties from Entra, HR, or other systems to create meaningful audience segments.
Read the official PAnalytics feature guideWho should be involved
Intranet owners, internal communications, Microsoft 365 administrators, adoption leads, and data or privacy stakeholders can align on the questions to measure.
What to define first
Agree which sites are in scope, which audiences matter, who may see reports, and how workplace-data retention should operate.
Useful first use cases
Measure an intranet launch, find unsuccessful searches, compare adoption by cohort, improve content timing, or monitor Microsoft 365 service usage.
What the first call covers
Privion describes a 30-minute scoping conversation and a live demo using the prospective customer’s tenant.
Why not built-in analytics?
Native SharePoint reports vs. PAnalytics.
See what PAnalytics can capture in your environment.
Ascend Sales Strategies introduces PrivionTech and PAnalytics to Microsoft-centric organizations ready to measure and grow SharePoint and Microsoft 365 adoption.
Planning an AI rollout? Start with Ascend's Microsoft 365 Copilot adoption guide to connect readiness, sustained usage, and measurable value. Partner leaders can also use our guides to Microsoft partner growth, outcome-based selling, and sales-system diagnostics.